BUTTSniffer
|
| < Day Day Up > |
|
And after we just spent all that time trying to convince you that sniffers can be respectable tools used by respectable people for respectable purposes, it figures that the first such tool in our discussion is called BUTTSniffer. Written by one of the members of the hacker group Cult of the Dead Cow (most famous for their Back Orifice tool, to which BUTTSniffer pays homage—see Chapter 10), BUTTSniffer is a stand-alone, command-line, Windows-based sniffing tool. (You can download it from http://www.packetstormsecurity.com/sniffers/buttsniffer.) It’s quite functional but rather complicated to use if you’re unfamiliar with the concepts. Let’s break it down.
Implementation
The first step in learning how to use sniffers is telling the sniffer what we want to know. We do that through the command line. When we run BUTTSniffer without any options, we get a summary of the possible options:
BUTTSniffer v0.9 (c) 1998, Cult of the Dead Cow Usage: buttsniff -{idl} <arguments> -i (interactive) arguments: <device number> <port> -d (disk dump) arguments: <device number> <log file> <dump type> [filter] -l (list devices) arguments: (none) In addition to the options above, BUTTSniffer tells you about the valid dump types and filters (used in conjunction with the –d flag) that can be used as arguments. Dump types are specified using a single letter and are defined as follows:
-
r (raw frames) Choose this option to dump raw network traffic.
-
e (encapsulation) Choose this option to dump decoded packets with encapsulation information.
-
p (protocol) Use this option to dump fully decoded packets along with protocol information.
When performing a protocol dump, you can filter traffic based on a single port number (e.g. 80) or a port range (e.g. 20–80). Alternatively, you can specify a filename on the command line (e.g. filter.txt) that contains a list of IP and port filter rules. The syntax of that filter file will be discussed shortly.
BUTTSniffer has only three “modes”: device list, interactive, and disk dump. The device list mode tells you what network interfaces it finds on your machine. Each network interface, even dial-up adapters, have device numbers assigned to them. In BUTTSniffer’s other two modes, you’ll need to know the device number of the interface on which you want to sniff traffic, so device list mode is the first step. Interactive and disk dump modes require a bit more investigation and are covered next.
Interactive Mode
We’ll start with interactive mode because it’s made with the beginner in mind. The command line for interactive mode tells you to specify a device number (for the interface you want to monitor) and a port. Now this port isn’t what you think. It’s not asking you on what port you want to sniff traffic; it’s asking you to provide an available port to which its interactive daemon can bind. The interactive mode works by setting up a daemon on the specified port, say 8888 (that is, buttsniff –i 0 8888). You can then type telnet localhost 8888 at your command prompt and you’ll be connected to the daemon. You should see the BUTTSniffer interactive main menu with the following options:

Monitor Connections The first option, Monitor Connections, does just that. Any IP sessions that pass on, through, or by the interface we’re watching (which is device number 0 from our example command line) should show up here. We can give it a try by opening up a few web and telnet connections and seeing what happens. Select Monitor Connections and press ENTER.

We can see a telnet and a few web sessions from my IP address. If we scroll up or down to a particular connection, we can monitor the connection. Here we’re listening in on a telnet session:
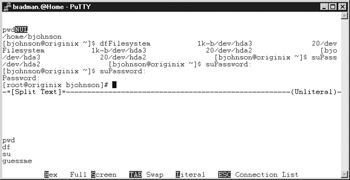
The output isn’t pretty by any means, but if you look carefully, you can see that we’ve just captured the root password on this box: “guessme.” The user’s keystrokes are logged in the bottom section of the screen and the output from the commands is listed in the top section. After the user typed su, he typed in the root password guessme. As we can see from the output in the top section, he successfully became root. If you look at the bottom of the screen, you’ll see some display options you can select. Full Screen is particularly useful if you care only about what the user is typing.
| Note | Remember reading that no one should use telnet anymore? This is why. All your telnet traffic is readable by anyone with this tool who can get between you and your destination. |
Now, to illustrate the importance of using encryption, let’s take a look at the exact same activity and commands from a sniffed SSH session:

Not quite as useful, is it? Encryption keeps the root password safe.
Password Sniffer We were able to grab a password in the telnet session using the Monitor Connections option, but the Password Sniffer option looks only for login attempts and attempts to grab any usernames and passwords that pass in the clear. In the following example, the user is telnetting to originix as the user “bob” and then becoming the root user. BUTTSniffer is smart enough to pick up the initial “bob” login because it’s the beginning of the connection, but it won’t pick up on an su to the root user. This means we’d still need to watch using the Monitor Connections mode to pick that up. Many systems won’t let you telnet into a box as root.

The interactive mode is pretty easy to use, but we’re not recording any of this data anywhere. You’ll learn how to do that shortly when we cover the disk dump mode in “Disk Dump Mode.”
Configure What if you were on a machine that was in heavy use with hundreds of connections taking place at one time? How would you be able to sort through all the “noise” and find the information you’re looking for?
This menu option lets you set up filters for the interactive mode. It tells BUTTSniffer to watch only for particular kinds of network traffic to or from particular hosts. It’s important that you get a grasp on how these filters work, because we’ll be specifying them in text files when we get to the next program mode (disk dump).
The main purpose of the Configure menu is to turn on the filters, which are similar in usage and style to that of the Berkeley Packet Filter (BPF) schema. Notice in the following illustration that we first specify to exclude all IP addresses (*.*.*.*) and then include only 192.168.1.100. That’s the way BUTTSniffer works. By default, it includes everyone and everything that it can. Before you can specify on which hosts and ports you want to focus, you have to exclude the ones you don’t care about.

Two other options are listed here. First, we can choose to monitor only valid TCP connections. Abnormal connections, such as those that nmap stealth scans make when port-scanning a network, will be ignored. The second option, War Mode, is a throwback to the origin of this sniffer as a plug-in for the hacker backdoor suite Back Orifice. Since BUTTSniffer was originally intended to help monitor network traffic on an owned (hacked) Windows box, engaging War Mode would allow the user to hijack certain network connections and reset them, frustrating the unknowing user of the system.
If you want to make sure that no one has put an interactive BUTTSniffer on your system, you can use some of the tools we’ve talked about in other chapters. Locally, netstat will tell you what TCP ports are open and listening on your Windows box. If you see something you don’t recognize, telnet to it and see what comes up. Remotely, port scanners such as nmap or SuperScan (Chapter 4) can identify unusual TCP ports. Since some of these tools can actually grab banners from the ports, you’ll see a bunch of gibberish from the BUTTSniffer daemon port (shown next). You can telnet directly to it to confirm its presence.
[" [4l [12h [20l [?1h [?2h [?3l [?5l [?7l [?6l [H [2J " [4l [12h [20l [?1h [?2h [?3l [?5l [?7l [?6l [H [2J [H [2J [1;1;H [7m BUTTSniffer v0.9 coded by DilDog]
Disk Dump Mode
If you want to monitor for certain types of activity over a long period of time, it’s a lot easier to use disk dump mode. With this mode, you lose many of the “ease-of-use” features of the interactive mode, but you gain the power to log the activity to a file in certain formats, which allows you to start off the sniffer, leave it running for a day, and then analyze the logfile later. Hackers or system administrators might even write scripts to generate reports based on the sniffer output files.
As with interactive mode, the command line for disk dump mode has the device number of your interface (obtained by first running buttsniff -l) as the first argument. The second argument is the name of the file you want to use as your sniffer log. The third option is the kind of logfile or dump type you’re looking to generate. If you remember the beginning of the "Implementation" section, there are three possible choices for the dump type: raw (r), encapsulation (e), and protocol (p). Raw and encapsulation are useful only if you have a hex editor and a strong knowledge of the protocol you’re sniffing to be able to pick through it byte by byte. Most of us will choose to use the protocol option, as it decodes the TCP packets for us and displays them in an informative but easy-to-read format.
Using the command buttsniff –d 1 proto.log p, here’s some of the output from a logfile:
Source IP: 192.168.1.101 Target IP: 192.168.1.100 TCP Length: 0 Source Port: 2111 Target Port: 23 Seq: 0919F2F2 Ack: 00000000 Flags: S Window: 65535 TCP ChkSum: 64163 UrgPtr: 0 Source IP: 192.168.1.100 Target IP: 192.168.1.101 TCP Length: 0 Source Port: 23 Target Port: 2111 Seq: 7BFD410D Ack: 0919F2F3 Flags: SA Window: 32120 TCP ChkSum: 49167 UrgPtr: 0 Source IP: 192.168.1.101 Target IP: 192.168.1.100 TCP Length: 0 Source Port: 2111 Target Port: 23 Seq: 0919F2F3 Ack: 7BFD410E Flags: A Window: 65535 TCP ChkSum: 27212 UrgPtr: 0 Source IP: 192.168.1.101 Target IP: 192.168.1.100 TCP Length: 3 Source Port: 2111 Target Port: 23 Seq: 0919F2F3 Ack: 7BFD410E Flags: PA Window: 65535 TCP ChkSum: 19269 UrgPtr: 0 00000000: FF FB 1F ÿû. Source IP: 192.168.1.100 Target IP: 192.168.1.101 TCP Length: 0 Source Port: 23 Target Port: 2111 Seq: 7BFD410E Ack: 0919F2F6 Flags: A Window: 32120 TCP ChkSum: 60624 UrgPtr: 0 Source IP: 192.168.1.101 Target IP: 192.168.1.100 TCP Length: 18 Source Port: 2111 Target Port: 23 Seq: 0919F2F6 Ack: 7BFD410E Flags: PA Window: 65535 TCP ChkSum: 10271 UrgPtr: 0 00000000: FF FB 20 FF FB 18 FF FB 27 FF FD 01 FF FB 03 FF ÿû ÿû.ÿû'ÿý.ÿû.ÿ 00000010: FD 03 ý.
We’ve collected quite a bit of information here, so let’s break it down a bit.
Clearly, every packet has its own log entry. We see from the first packet that 192.168.1.101 has sent a packet to 192.168.1.100 with a target port of 23 (telnet). If we take a look at the flags on this packet, we see that the S, or SYN, flag is set. The SYN flag indicates the initiation of a TCP connection. The next line shows a response from 192.168.100 back to 192.168.1.101’s target port (2111, in this case) with the SA, or SYN/ACK, flag set. The next line is from 192.168.1.101 and shows a packet with the A, or ACK, flag set. This is TCP’s "three-way handshake" methodology for establishing a connection.
So we’ve clearly caught the beginning of a telnet connection between these two hosts. None of these first three packets have any data beyond the TCP headers, but if we look down some more, we see a hex and ASCII dump of some gibberish retrieved from the data field of the TCP packets. Remember that before telnet presents you with a login prompt, the client and server negotiate some telnet options (terminal type, for example). This gibberish is just that. If we look past it, we should be able to find some more valuable information. Now let’s look at some useful text:
Source IP: 192.168.1.100 Target IP: 192.168.1.101 TCP Length: 7 Source Port: 23 Target Port: 2111 Seq: 7BFD418A Ack: 0919F33F Flags: PA Window: 32120 TCP ChkSum: 35305 UrgPtr: 0 00000000: 6C 6F 67 69 6E 3A 20 login: Source IP: 192.168.1.101 Target IP: 192.168.1.100 TCP Length: 0 Source Port: 2111 Target Port: 23 Seq: 0919F33F Ack: 7BFD4191 Flags: A Window: 65404 TCP ChkSum: 27136 UrgPtr: 0 Source IP: 192.168.1.101 Target IP: 192.168.1.100 TCP Length: 1 Source Port: 2111 Target Port: 23 Seq: 0919F33F Ack: 7BFD4191 Flags: PA Window: 65404 TCP ChkSum: 2039 UrgPtr: 0 00000000: 62 b Source IP: 192.168.1.100 Target IP: 192.168.1.101 TCP Length: 1 Source Port: 23 Target Port: 2111 Seq: 7BFD4191 Ack: 0919F340 Flags: PA Window: 32120 TCP ChkSum: 35322 UrgPtr: 0 00000000: 62 b Source IP: 192.168.1.101 Target IP: 192.168.1.100 TCP Length: 1 Source Port: 2111 Target Port: 23 Seq: 0919F340 Ack: 7BFD4192 Flags: PA Window: 65403 TCP ChkSum: 64245 UrgPtr: 0 00000000: 6F o Source IP: 192.168.1.100 Target IP: 192.168.1.101 TCP Length: 1 Source Port: 23 Target Port: 2111 Seq: 7BFD4192 Ack: 0919F341 Flags: PA Window: 32120 TCP ChkSum: 31992 UrgPtr: 0 00000000: 6F o Source IP: 192.168.1.101 Target IP: 192.168.1.100 TCP Length: 1 Source Port: 2111 Target Port: 23 Seq: 0919F341 Ack: 7BFD4193 Flags: PA Window: 65402 TCP ChkSum: 2037 UrgPtr: 0 00000000: 62 b Source IP: 192.168.1.100 Target IP: 192.168.1.101 TCP Length: 1 Source Port: 23 Target Port: 2111 Seq: 7BFD4193 Ack: 0919F342 Flags: PA Window: 32120 TCP ChkSum: 35318 UrgPtr: 0 00000000: 62 b
192.168.1.101 was presented with a login prompt. If we focus on the packets coming from source 192.168.1.101 headed to target 192.168.1.100, we see that the user typed b-o-b. Each time 192.168.1.101 sent a character, 192.168.1.100 echoed it back. The telnet server “echoes” what we type when it acknowledges receipt of our characters. Otherwise, everything we typed would never get displayed within the client. With the telnet protocol, keystrokes are immediately sent to the server instead of getting buffered by the client.
If we look down a little further, we’ll find the really useful information:
Source IP: 192.168.1.100 Target IP: 192.168.1.101 TCP Length: 10 Source Port: 23 Target Port: 2111 Seq: 7BFD4196 Ack: 0919F344 Flags: PA Window: 32120 TCP ChkSum: 1056 UrgPtr: 0 00000000: 50 61 73 73 77 6F 72 64 3A 20 Password: Source IP: 192.168.1.101 Target IP: 192.168.1.100 TCP Length: 0 Source Port: 2111 Target Port: 23 Seq: 0919F344 Ack: 7BFD41A0 Flags: A Window: 65389 TCP ChkSum: 27131 UrgPtr: 0 Source IP: 192.168.1.101 Target IP: 192.168.1.100 TCP Length: 1 Source Port: 2111 Target Port: 23 Seq: 0919F344 Ack: 7BFD41A0 Flags: PA Window: 65389 TCP ChkSum: 2034 UrgPtr: 0 00000000: 62 b Source IP: 192.168.1.100 Target IP: 192.168.1.101 TCP Length: 0 Source Port: 23 Target Port: 2111 Seq: 7BFD41A0 Ack: 0919F345 Flags: A Window: 32120 TCP ChkSum: 60399 UrgPtr: 0 Source IP: 192.168.1.101 Target IP: 192.168.1.100 TCP Length: 1 Source Port: 2111 Target Port: 23 Seq: 0919F345 Ack: 7BFD41A0 Flags: PA Window: 65389 TCP ChkSum: 64240 UrgPtr: 0 00000000: 6F o Source IP: 192.168.1.100 Target IP: 192.168.1.101 TCP Length: 0 Source Port: 23 Target Port: 2111 Seq: 7BFD41A0 Ack: 0919F346 Flags: A Window: 32120 TCP ChkSum: 60398 UrgPtr: 0 Source IP: 192.168.1.101 Target IP: 192.168.1.100 TCP Length: 1 Source Port: 2111 Target Port: 23 Seq: 0919F346 Ack: 7BFD41A0 Flags: PA Window: 65389 TCP ChkSum: 2032 UrgPtr: 0 00000000: 62 b Source IP: 192.168.1.100 Target IP: 192.168.1.101 TCP Length: 0 Source Port: 23 Target Port: 2111 Seq: 7BFD41A0 Ack: 0919F347 Flags: A Window: 32120 TCP ChkSum: 60397 UrgPtr: 0 Source IP: 192.168.1.101 Target IP: 192.168.1.100 TCP Length: 1 Source Port: 2111 Target Port: 23 Seq: 0919F347 Ack: 7BFD41A0 Flags: PA Window: 65389 TCP ChkSum: 14575 UrgPtr: 0 00000000: 31 1 Source IP: 192.168.1.100 Target IP: 192.168.1.101 TCP Length: 0 Source Port: 23 Target Port: 2111 Seq: 7BFD41A0 Ack: 0919F348 Flags: A Window: 32120 TCP ChkSum: 60396 UrgPtr: 0 Source IP: 192.168.1.101 Target IP: 192.168.1.100 TCP Length: 1 Source Port: 2111 Target Port: 23 Seq: 0919F348 Ack: 7BFD41A0 Flags: PA Window: 65389 TCP ChkSum: 14318 UrgPtr: 0 00000000: 32 2 Source IP: 192.168.1.100 Target IP: 192.168.1.101 TCP Length: 0 Source Port: 23 Target Port: 2111 Seq: 7BFD41A0 Ack: 0919F349 Flags: A Window: 32120 TCP ChkSum: 60395 UrgPtr: 0 Source IP: 192.168.1.101 Target IP: 192.168.1.100 TCP Length: 1 Source Port: 2111 Target Port: 23 Seq: 0919F349 Ack: 7BFD41A0 Flags: PA Window: 65389 TCP ChkSum: 14061 UrgPtr: 0 00000000: 33 3
Looks like we’ve sniffed bob’s rather clever password. Again, by focusing only on the packets coming from source 192.168.1.101 to target 192.168.1.100, we see the user typed b-o-b-1-2-3. Notice how the acknowledgement packets from the telnet server don’t echo the input, as happened with the username. This is as expected, because we don’t see our password printed on the telnet screen when we type it in.
Just as BUTTSniffer’s interactive mode has filters, the disk dump mode has an optional “filter file” that can be specified at the end of the command line. The file uses the same technique used with the interactive menu. An empty filter file tells BUTTSniffer to log everything. If you want to focus on a specific IP or port, you first need to exclude everything else.
Here’s the syntax of a filter file that sets up the same filter we set up in interactive mode:
-*.*.*.* +192.168.1.100 –0-65535 +23 +80
It’s pretty straightforward. It says to exclude all IP addresses but 192.168.1.100. It then says to exclude all ports except 23 and 80. Save this text as myfilter.fil or whatever you please, and then run the command buttsniff –d 1 sniff.log p myfilter.fil to sniff only telnet and web activity to and from 192.168.1.100.
| Tip | If you don’t need to filter on an IP but need to filter a port, you don’t need to create a filter file. You can simply replace myfilter.fil in this example with a single port number or a port range, such as buttsniff –d l sniff.log p 23. If you want to specify multiple ports not in a range, you’ll still need to use the filter file. |
|
| < Day Day Up > |
|
EAN: 2147483647
Pages: 189